
What is "Observability"
Why is it necessary and what are the considerations in cloud-native monitoring? - vol.1
Observability has become increasingly important in recent years as systems become more complex and has been highlighted as "Applied Observability." Applied Observability is listed one of Gartner® Top 10Strategic Technology Trends for 2023.*1 "Applied Observability" is also a topic of interest to CxOs.
This paper explains the importance of Observability from both a managerial and technical perspective.
With the recent shift of systems to cloud computing and microservices, it is important from a managerial perspective to solve the following problems in system operation and monitoring.

Issues
Visualization of complex systems:
In recent years, the systems and applications of companies have become increasingly complex. They consist of multiple microservices, cloud infrastructures, and components provided by third parties, making it extremely challenging to monitor and troubleshoot them. The longer it takes to resolve issues, the more time is lost in terms of business opportunities, and it can also lead to the loss of customer trust.
Real-time trouble detection:
When a part of a system is in an abnormal state, it is important to detect and deal with it as early as possible. However, with conventional monitoring methods, it takes time to detect an anomaly, and the problem may become more serious. If abnormal states are not detected quickly, information about system failure may spread instantly via social networking services which can easily lead to a loss of company trust. And it is not easy to regain trust once it has been lost.
Root cause analysis difficulties:
When system trouble occurs, it is very difficult to identify the cause of the trouble. Especially in decentralized systems, finding the root cause of trouble is difficult, time-consuming, and labor-intensive. The time it takes to find the root cause can likewise lead to lost business opportunities and lost customers.
Observability is a means of visualizing systems that has been gaining attention in recent years, and by using Observability, you can enjoy the following benefits:
Benefit
Early problem resolution: Observability allows for real-time detection of abnormal system behavior and early problem resolution. This minimizes system outages and failures; thereby minimizing lost business opportunities.
Root cause identification: Observability provides a comprehensive collection and visualization of overall system status, performance metrics, and logs. This provides clues to identify the cause of problems as they occur, improving troubleshooting efficiency, and mitigating lost business opportunities.
Improved user experience: Smooth system monitoring and troubleshooting leads to an improved user experience. Improved system availability and performance will increase customer satisfaction and maximize business results.
Predictive maintenance and automation: Observability enables system monitoring and trouble prediction. When an anomaly is detected, the system automatically alerts and responds to the problem, shortening time to problem resolution, increasing operational efficiency, and reducing operation costs.
Addressing the issues to be solved by Observability and the resulting benefits are important from a managerial perspective. Investing in Observability is worth considering because it contributes to improving operational efficiency and maximizing business results.

Challenges of Monitoring Cloud-Native Systems and Observability
Observability is the concept of keeping a system observable; what is happening, when, and where. This allows for problem detection and root cause identification, even for complex and dynamically scaling services.
The concept of Observability is increasingly being considered as part of the cloud-native technology stack. The word "Observability" is described as one of the technical elements in "Cloud Native Definition" and "Microservices Architecture Pattern" as well. This shows that Observability is an important concept when considering cloud-native distributed architectures.
Why is Observability often mentioned with these cloud-native technologies? The challenges of monitoring cloud-native systems are due to the complexity of the system, as shown below in the Kubernetes example, and the need to "maintain observability of what is happening, when, and where" using appropriate technology to ensure stable operation of a system with these challenges.
- Multi-layered combination of many distributed components (multiple pods running on multiple nodes)
- Need a mechanism to automatically track components such as pods and nodes based on the following two backgrounds:
- Difficult to track because the number of pods, the execution unit of the component, dynamically changes due to autoscaling and the pod ID changes during failover.
- Components are frequently added or changed.
- When there are component-to-component calls, it is necessary to trace the impacted area of individual components.
So far, we have explained Observability in a high-level perspective with the expression "keep observable," but from what specific perspective should we use such a technology?
Observability itself has been discussed a lot and explained in many different ways, but in fact, "Observability Whitepaper" * is the document published by Cloud Native Computing Foundation (CNCF) that defines Observability itself, its elements, and best practices.
- * CNCF's TAG (Technical Advisory Group: a group that provides technical guidance for specific technologies) is the Observability TAG. In 2021, Observability Whitepaper was released as the culmination of the cloud-native Observability effort with clear terminology, definitions, and best practices.
This paper will cover the main points of Observability referring to the whitepaper.
Components of Observability (Signal)
The key question in considering how to achieve Observability is "what should be observed?" The whitepaper defines the output generated by the system as a "signal". By observing these signals, we can infer "what the system is doing" from the outside.
The three widely recognized signal pillars of Observability are "metrics," "logs," and "traces," which are represented in the whitepaper in the figure below.
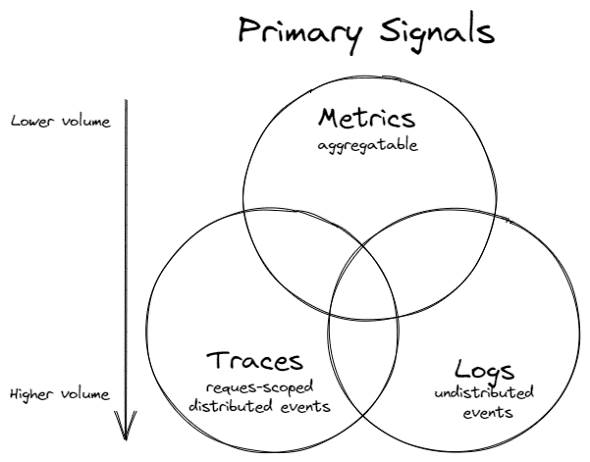
Three pillars of Observability (metrics, logs, traces)
adapted from https://github.com/cncf/tag-observability/blob/main/whitepaper.md
The reason why these three signals are considered the three pillars is that in increasingly complex cloud-native architectures, it is difficult to identify problem areas with traditional monitoring alone, and problems cannot be identified unless they are linked to logs and traces. It is important to be able to search for and visualize the problem by linking and transforming the signals as needed rather than using each as an independent element. This is the reason why each signal is overlapped in the figure above.
The following is a brief explanation of the three pillars and other signals that may be discussed, and what each signal refers to and what perspectives are important.
What are metrics?
Metrics are numerical data such as server resource status (e.g., CPU utilization) and service status (latency, transaction volume, error rate, etc.) that serve as indicators and have long been monitored items.
It has the following characteristics:
- Since it is limited to numerical data only, the volume of data is relatively small compared to other signals, making it easy to transmit, store, process, and visualize, and it can be used for real-time understanding, detection, and refinement of the situation.
- Because it is numerical data, it can be alerted at threshold values and statistically tabulated and analyzed later.
- It is difficult to make sense of the data if you only check a single numerical value, but it is possible to use the data to check trends over time and compare them to threshold values.
Metrics, while immediate and easy to read because they essentially deal with numerical data in a time series, often lack information (why that number and what is its relationship to others). Thus, metrics do not necessarily reveal root causes but often provide the high-level overview needed to orient the problem and provide a starting point for root cause investigation.
Usually utilized in two ways: "real-time monitoring and alerts" and "trend analysis and future forecasting".
Elements of Metrics - "RED Method" and "USE Method"
Metrics can be broadly divided into two categories: the first is the monitoring of service availability and the second is the monitoring of server and container resource availability, each of which is referred to by the initials "RED method" and "USE method".
The RED method monitors the following three key indicators of service availability:
- Rate: Number of requests per second (req/sec)
- Error Rate: Error rate
- Duration: Latency, response time
Monitor the service level of that service from the end user's point of view (how many accesses are coming in and how fast and successfully are they responding).
SLI (Service Level Indicators) and SLO (Service Level Objectives) should be assembled based on this metric, as it is directly related to customer experience (CX) and can quantitatively express the delivery of the service itself.
It is basically preferable that prioritization during alerts and failure responses also be based on this metric. This is because even if server resource usage is high, and if there is no user impact, it cannot be evaluated as a "well utilized resource and not a problem" at that point in time. The idea is, "Let's prioritize events that have user impact."
- Reference:
- https://grafana.com/blog/2018/08/02/the-red-method-how-to-instrument-your-services/
- https://www.weave.works/blog/the-red-method-key-metrics-for-microservices-architecture/
The USE method monitors the following three elements, which are important indicators of a server's resource status.
- Utilization: Utilization (e.g., CPU utilization)
- Saturation: Saturation, how much the queue is packed (load average, etc.)
- Errors: Number of error events (e.g., pod restart)
By checking service monitoring metrics together, it is possible to identify the bottleneck. In addition, if the bottleneck characteristics of the system have been identified in advance through load testing, etc., it can be detected and addressed before the impact on users becomes apparent by focusing monitoring on that area.
However, be careful to be selective and focused, because if you skip too many alerts about everything, you will become like "the boy who cried wolf" and miss important information.
- Reference:
Metrics difficulties in cloud-native architectures
As mentioned in the introduction, cloud-native architectures complicate the task of collecting metrics for several reasons including:
- Multi-layered combination of many distributed components (multiple pods running on multiple nodes)
- The following background requires a mechanism to automatically track components such as pods and nodes:
- Difficult to track because the number of pods, the execution unit of the component, dynamically changes due to autoscaling and the pod ID changes during failover.
- Components are frequently added or changed.
Therefore, collecting metrics from a wide variety of components, following them to scale and recovery, and attaching them to consistent metadata (≒labels) for those metrics is a necessary metric collection technique. By attaching appropriate metadata (≒labels), it is easy to extract, graph, and review the metrics needed to create dashboards and troubleshoot.
The OSS which has features (scraping and labeling with service discovery, many publicly available exporters) to support the collection of metrics from a wide variety of components including dynamic components is "Prometheus". Together with the Grafana dashboard, it is the de facto OSS monitoring stack for Kubernetes.
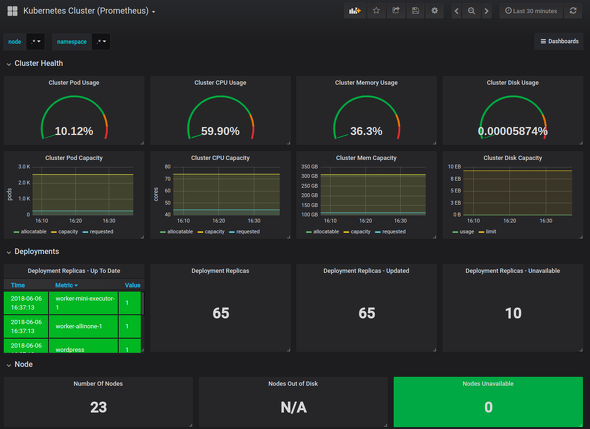
Kubernetes metrics dashboard retrieved by Prometheus
What is a log?
Logs, like metrics, are a traditional concept: detailed, human-readable, structured information that represents individual events (information about what is happening) on each server, middleware, application, etc. By keeping a record of these events, it is possible to understand and reproduce the sequence of events that caused a particular situation to occur.
There are many different types of logs. For example, the following logs are mentioned in Whitepaper.
| Log types presented in the Observability Whitepaper | |
|---|---|
| Log type | Summary |
| System log | Records events that occur inside the OS
|
| Infrastructure log | Logs of physical and logical equipment that affects IT infrastructure on-premises and in the cloud |
| Application log | Created when an event occurs in the application
|
| Audit log | Record events and changes "who performed the activity," "which activity was performed," and "how the system responded" |
| Security log | Logs created in response to security events that occur on the system |
These logs provide insight into the state of the system or application, which is especially useful when analyzing root cause in the event of a failure.
These logs can be visualized and analyzed via tools for log analysis. You can Grep search logs for details such as log level, error status, messages, code files, etc., visualize error counts per second, alerts, etc.
General considerations in logging include "log level" and "parsing and log format".
Log level
The importance of each log statement can be expressed by setting a log level for each log statement. Typically, levels such as "ERROR," "WARNING," "INFO," and "DEBUG" are used, with ERROR being the least detailed level and DEBUG being the most detailed.
- ERROR: Notify the reason for the failure and its details.
- WARNING: High level message that is not a fault but requires attention.
- INFO: help you understand "how the system works".
- DEBUG: Contains very detailed information for each action. Typically used during troubleshooting. Used only for short periods of time because of storage and performance implications.
Logs contain a large amount of text, and if the log level is unnecessarily detailed, the volume will be enormous, leading to performance degradation and increased storage costs during retrieval. On the other hand, there may be cases where information is not obtained because the log level is not detailed enough. Therefore, it is important to set the log level appropriately according to the situation and importance.
Parsing and log formatting
Logs can be converted into metrics by aggregating them. For example, counting the number of errors per second would be an easy image to understand.
However, for interactive analysis, alerts, and anomaly detection, such as search and visualization, the information must be represented in a uniform format. Typically, the information contained in logs is free-text data. Since it is difficult to extract the meaning mechanically as it is, it is important to unify the format or through a parsing process.
There is no specific log format that can be called de facto that can be used commonly, yet "Elastic Common Schema"and logfmt are available so far.
If such a unified format is not used, parsing processing can be performed on log collection/analysis tools. However, it is difficult to implement parsing processing for each of the various log formats, so it is necessary to devise a way to unify the formats to some extent.
Logging difficulties in cloud-native architectures
As with metrics, the complexity of collection tasks also occurs because cloud-native architectures also increase the complexity of log collection, aggregation, and analysis (visualization/search).
Also, in an environment with increased components in a cloud-native architecture, the amount of data in text logs is far greater than in numerically aggregated metrics, so large volumes of logs need to be properly labeled and searched/visualized from a variety of perspectives. The following considerations are important.
1. Mechanism for assigning labels that can be utilized when searching
It is difficult to filter later without being able to identify each log line in terms of the following:
- Which component (Container, Pod, Deployment, Namespace, Application)
- What outputted the log
- Log level
2. Cross-search mechanism for multiple logs
When examining logs, it is "rare" to look at a single line of a single log, but you will be looking at multiple logs. Therefore, it is important to be able to throw such queries on the dashboard that searches the logs.
3. Separate log storage for each tenant
Logs that are used frequently on a regular basis should be placed in separate storage for each tenant boundary, and there are two reasons. One is for performance reasons due to the large volume of logs, and the other is for security reasons: "The logs that application development engineers should normally see should only be logs for the services they are in charge of".
Since there are many cases where tenants are divided by Namespace in Kubernetes, there is a need to consider separate log storage for each Namespace. In addition, it is necessary to have a centralized storage for all app and infrastructure logs for troubleshooting by the infrastructure team.
The OSS log aggregation tool "Grafana Loki" supports labeling of each log line (log collection agent called "Promtail" and flexible search/visualization). Loki is one of the options for log aggregators in cloud-native architectures.
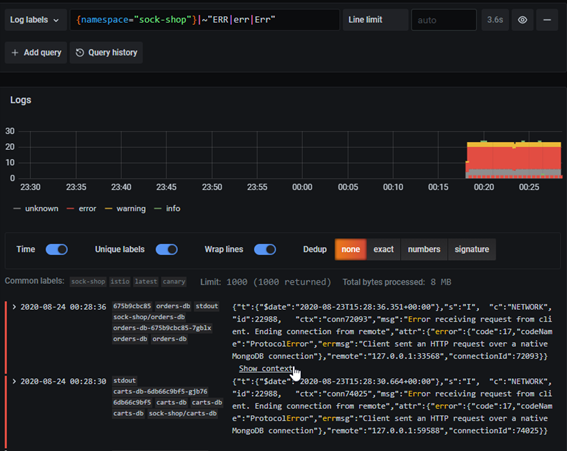
Visualization of logs aggregated in Loki (labels can be displayed and search function of logs can be checked)
Summary
In this article, we provided "Metrics" and "Logs" among the Components of Observability.
In the sequel to this article “What is "Observability" - Why is it necessary and what are the considerations in cloud-native monitoring? - vol.2", we will continue with "Trace" and other Observability signals and recommended OSS combinations.
-
*1
Gartner, "Gartner Top 10 Strategic Technology Trends for 2023", David Groombridge, Oct 17, 2022 (https://www.gartner.com/en/articles/gartner-top-10-strategic-technology-trends-for-2023)
GARTNER is a registered trademark and service mark of Gartner, Inc. and/or its affiliates in the U.S. and internationally and is used herein with permission. All rights reserved.
Continue reading the second part
Related Links
Original Article
- This article is translated and modified from ITmedia @IT's article「Observability(オブザーバビリティ)」「可観測性」とは何か――クラウドネイティブにおける監視で必要な理由と考慮点、お薦めのOSSの組み合わせ

