
To avoid crying over Kubernetes failures: Troubleshooting flow leveraging Observability - vol.2
This is a continuation of the first part, "To avoid crying over Kubernetes failures: Troubleshooting flow leveraging Observability - vol.1".
Closely Identify Layer
This layer goes further than the "Lightly Identify Layer" to identify more detailed events (which of the following events) and to check for the related components.
- Non-functional system issues
- Lack of resources for pod and node
- Middleware (MW), delayed by app logic
- Node failure
- Functional system issues
- Resource quota violation
- Eviction
- Container image pull error
- Container shutdown due to Liveness probefailure
- Middleware and application errors
In the figure below, the "Closely Identify Layer" flow section is extracted.
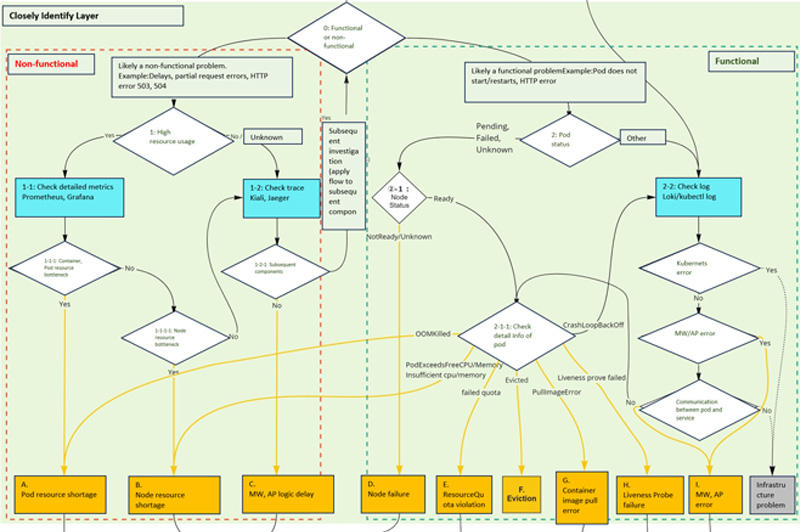
Closely Identify Layer
In the flow, the three signals of Observability are used to isolate the problem. As shown in the blocks colored blue and through several branches, the full extent of the problem event is understood, and the problem location is identified. The goal of this layer is to identify the event and the location of the problem (to reach the orange box at the bottom).
[0] Non-functional or functional, which is more likely?
First, based on the information we have obtained so far, we will determine "whether a non-functional failure such as performance is more likely, or whether a functional failure caused by the container itself, middleware, or apps running on the pod is more likely".
For example, if an error is returned for a delay or only part of a request, or if HTTP errors "503" (Service Unavailable) or "504" (Gateway Timeout) are returned, the service may be experiencing a delay or failure, so proceed with non-functional related analysis.
If the pod does not start, restarts repeatedly, or returns HTTP errors other than the above, the cause may be a failure of middleware or applications running on the pod, so proceed with function-related analysis.
Of course, it is often difficult to determine clearly which is the issue at this stage, so it is best to proceed solely based on "which seems more likely".
[1] Whether resource usage is high or not (non-functional related)
Here, we first take a quick look at the resource usage, as the service may be experiencing delays or failures. From the metrics information summarized at the Cluster and Namespace level, as seen in the "lightly identify layer" summary dashboard, we can see if there are any components with high resource usage.
If there seems to be a component with high resource usage, go to "[1]-1 Check Detailed Metrics". If you do not see any components with high resource usage, check the service dependency graph and distributed tracing in the "Lightly Identify Layer".
[1]-1 Confirmation of detailed metrics
The components whose resource usage we are concerned with are basically containers, pods or nodes. Therefore, we check resource usage in detail in "whether it is a resource bottleneck for containers or pods" and "whether it is a resource bottleneck for nodes", respectively.
Resources are the CPU utilization, memory usage, disk I/O, network I/O and so on. The key here is to collect metrics so that you can see each of these metrics.
Container, pod resource bottleneck or not
Container and pod level resource usage can be easily collected by scraping from Prometheus, especially since metrics are collected and published by "kubelet" without deploying the "Prometheus Exporter".
When analyzing the resources of containers and pods, it is important to note the resource requirements of each container placed within a pod.
Resource requests include "requests" and "limits": requests are the minimum resource requirements of a container in a pod when scheduling a pod to a node; limits are the hard limits of resources in a container in a pod.
Therefore, it is necessary to check the resource usage of the container as well as the definition of limits. Limits and requests can also be collected as metrics and should be visualized in graphs.
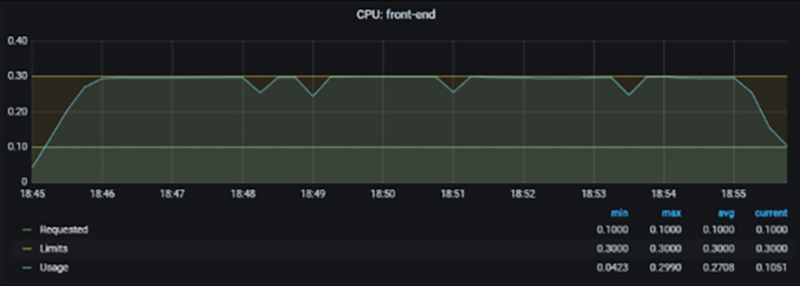
Example of container CPU usage violating limits
In this example, we can see that the CPU usage of the "front-end" container is limited to 0.3. If it turns out to be a resource bottleneck for the pod or container, use/refer "the Thoroughly Identify Layer to address "A. Lack of Pod resources"
Whether node is a resource bottleneck
For node-level resource usage, the "Node Exporter" can be deployed to collect metrics. Basically, the aspects to be checked are the same as for conventional server resources (CPU, memory, network, and disk).
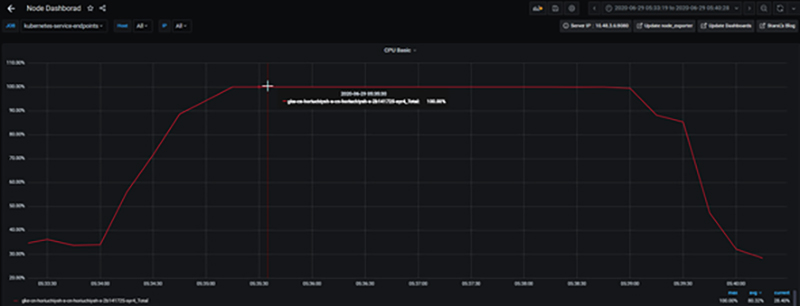
Example of node CPU utilization reaching 100% and CPU resources being exhausted
If it turns out to be a resource bottleneck in the node, it will be "layer that turns out to be a resource bottleneck in Node" will be addressed in the "B. Node's resource shortage".
[1]-2 Confirmation of trace
If resource usage is not high, there are two possibilities:
- Possibility that something is occurring within the component that is causing delays or failures without using pod resources.
- Possible delays or failures in subsequent components called by the component under investigation.
Therefore, the first step is to check for the existence of subsequent components, and if there are no subsequent components, the middleware or apps on the component is the suspect (we know that resources have not been exhausted up to this point), so move on to the "Closely Identify Layer" "C. Delay due to middleware or app logic" for further analysis.
If subsequent components exist, it is necessary to investigate what the status of the subsequent components is, so check the distributed tracing to see if there are any latencies or errors caused by the subsequent components, and then apply this troubleshooting flow to the subsequent components as well to proceed with the investigation.
For example, if you implement distributed tracing with "Jaeger," you can check how much of the latency of the calling service is accounted for by the latency of the destination service, as well as HTTP error codes and messages, as shown in the figure below.
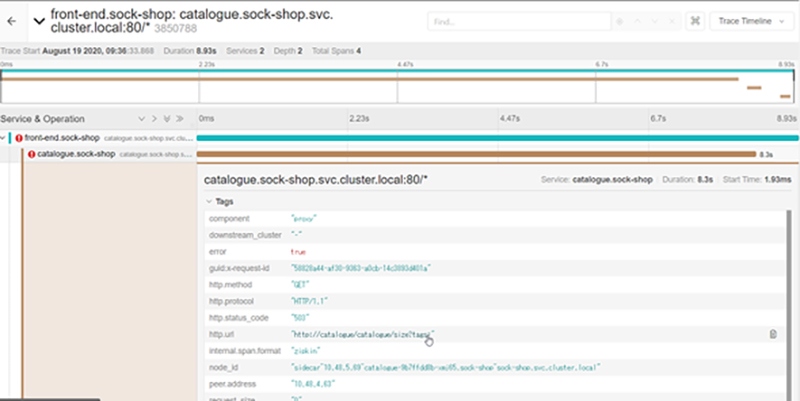
Distributed tracing with Jaeger
[2] Check the status of the Pod (function-related)
Here, it could be a functional failure caused by the container itself, middleware, or apps running on the pod.
First, check the status of the pod which can be obtained, for example, with the command "kubectl get pod". If there are multiple pods, it is recommended to filter them by label.
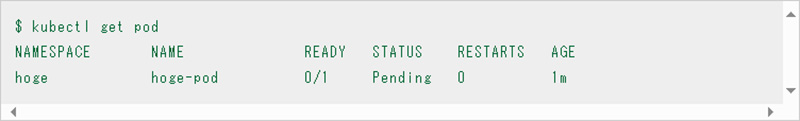
If the status of this pod is "Pending," "Failed," or "Unknown" as shown above, we will check more detailed information from here.
*For more information on the Pod lifecycle, see Pod Lifecycle | Kubernetes.
*Status information on these Kubernetes resources such as pods and containers can be viewed from the web screen of each cloud's monitoring function in the case of managed Kubernetes. You can also check them as metrics from Prometheus by using the Prometheus exporter called "kube-state-metrics".
[2]-1 Check the status of the node
One of the reasons why the pod could not be deployed may be a failure of the node, so we will check the status of the node.
Node status can be obtained, for example, with the "kubectl get nodes" command.
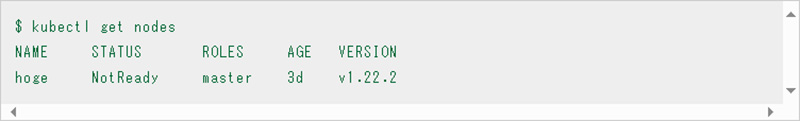
If the status of this node is "NotReady" or "Unknown", there is a high possibility that there is a failure around the node, so move on to the "Thoroughly Identify Layer" "D. Node Failure" to analyze the root cause.
[2]-1-1 Confirmation of detailed information on pod (Pod state reason, Event)
You can review detailed information about the pods through the following fields.
- Pod Status
- status.phase: "Running", "Pending", "Succeeded", "Failed", "Unknown".
- status.reason: "Evicted" etc.
- Events "Insufficient cpu" etc.
- Container Status
- status.containerStatuses.state: "Running", "Waiting", "Terminated
- status.containerStatuses.state.waiting.reason: "ErrImagePull", "ImagePullBackOff", "CrashLoopBackOff", etc.
- status.containerStatuses.state.terminated.reason: "OOMKilled" etc.
These can be checked, for example, with the commands "kubectl describe pod" and "kubectl get pod -o yaml". This allows you to check the status of the pod, the container that it is about to be deployed on, and the history of events that have occurred to the pod.
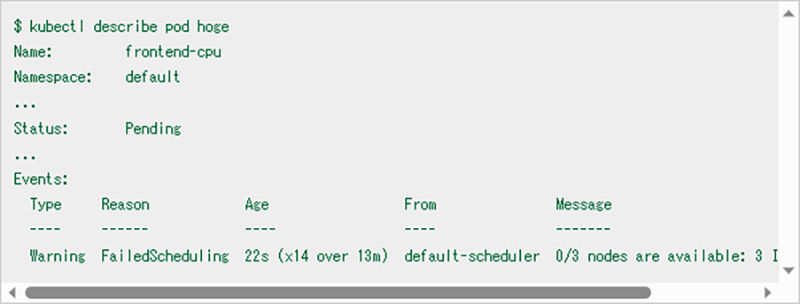
In this example, "Insufficient CPU" is recorded as an event that occurred on the pod, indicating that the node's CPU was exhausted, and the pod could not be deployed.
In this case, it is important to check whether the node has enough CPU for the CPU request in the container requests mentioned above.
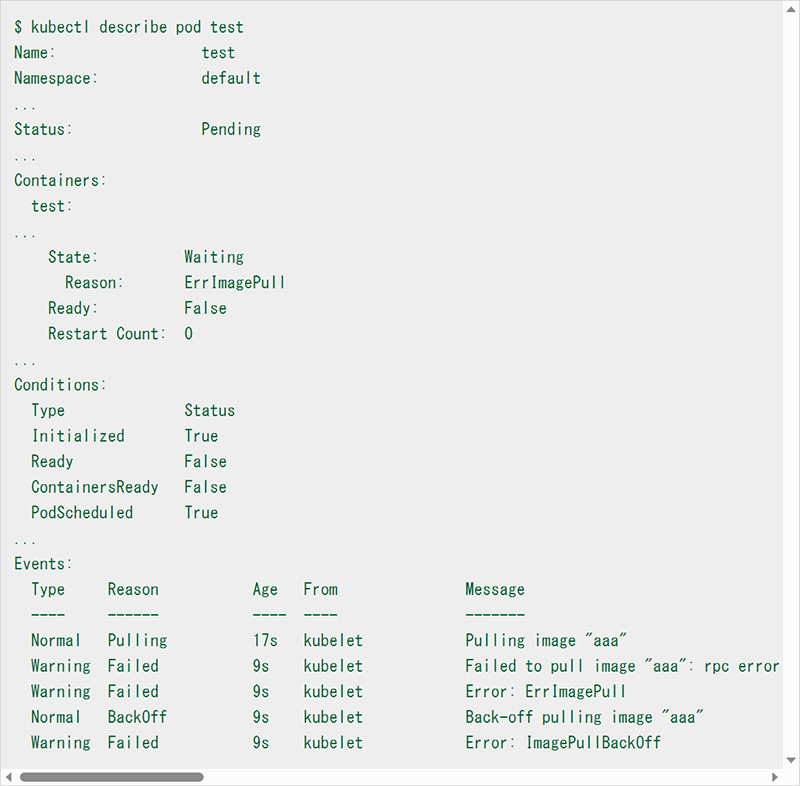
In this example, from the "Reason" of "State: Waiting" in "Containers" (the path in the pod resource definition is "status.containerStatuses.state.waiting.reason"), we can see the reason "ErrImagePull" which indicates that the container deployment has not completed and the pull of the image "aaa" failed as an event.
Thus, by checking the detailed information of the pod, you can see for what reason the status of the pod is either Pending, Failed, or Unknown. In the flow, we include branches for commonly occurring problems. Here we have extracted only the branches that result from the pod detail information.
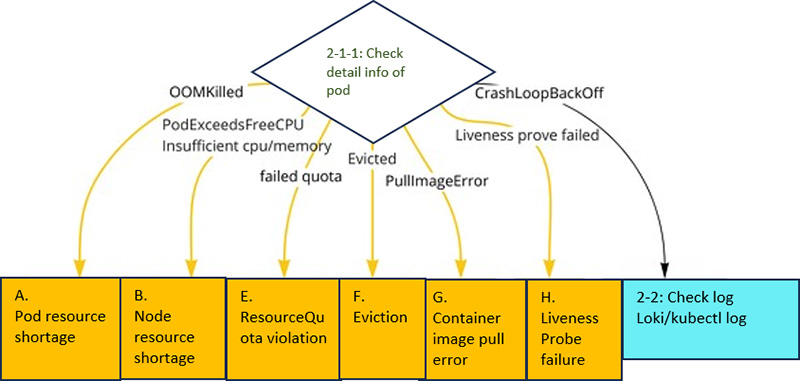
Branching by pod detail results in Closely Identify Layer
The meaning of each error is as follows:
"OOMKilled" (status.containerStatuses.state.waiting.reason)
Memory allocated to the container is exhausted and the process is killed by "OOM Killer"
→ Handle the issue in "Thoroughly Identify Layer" as "A. Pod resource shortage".
"...PodExceedsFreeCPU/Memory..." "Insufficient cpu/memory..." (Events)
Pod is requesting more resources than availability of Node.
→ Handle the issue in "Thoroughly Identify Layer" as "B. Node's resource shortage".
-
"...exceeded quota... " "...failed quota... " (Events)
Resource Quota is set for Namespace, but no limits or requests are set, or the Quota is exceeded.
→ Handle the issue in "Thoroughly Identify Layer" as "E. Resource Quota violation".
-
"Evicted" (status.reason) .
Pod is now subject to eviction (Evict). Eviction is performed when a node runs out of resources.
→ Handle the issue in "Thoroughly Identify Layer" as "F. Eviction".
-
"ErrImagePull" "PullImageError" (status.containerStatuses.state.waiting.reason)
Failure to acquire image
→ Analyze the case of the failure in "Thoroughly Identify Layer" as "G. Container Image Pull Error".
-
"...Liveness prove failed... Liveness prove failed..." (Events)
Liveness Prove fails and the container is repeatedly restarted.
→ Handle the issue in "Thoroughly Identify Layer" as "H. Container restart due to Liveness Prove Failure".
-
"CrashLoopBackOff" (status.containerStatuses.state.terminated.reason)
Container is restarting repeatedly.
→ The container may be restarting due to an error or crash in the application or middleware, go to "[2]-2 Checking the log".
[2]-2 Confirmation of logs
If the cause of the shutdown/restart is unclear despite checking detailed container and pod information, check the logs.
First, check if Kubernetes management components (control plane, kube-proxy, coredns, etc.) are giving errors. Next, check to see if any middleware or apps are giving errors.
*Errors in the management component are out of the scope of this flow as an infrastructure issue.
Even if you cannot confirm any middleware or application error, use the "kubectl port-forward" and "kubectl exec" commands to check whether the middleware and application are running properly.
For the most part, if you can figure out what part of the middleware or app is causing the error, you can "get a good idea" of what the error is. "I. Middleware and app errors" for detailed analysis.
The tool you use to view the logs can be a log aggregation infrastructure like Loki to view logs across the board, or you can use the "kubectl logs" command to check the logs if the pods have been identified. You can use different tools depending on the ease of switching between them and the amount of target components.
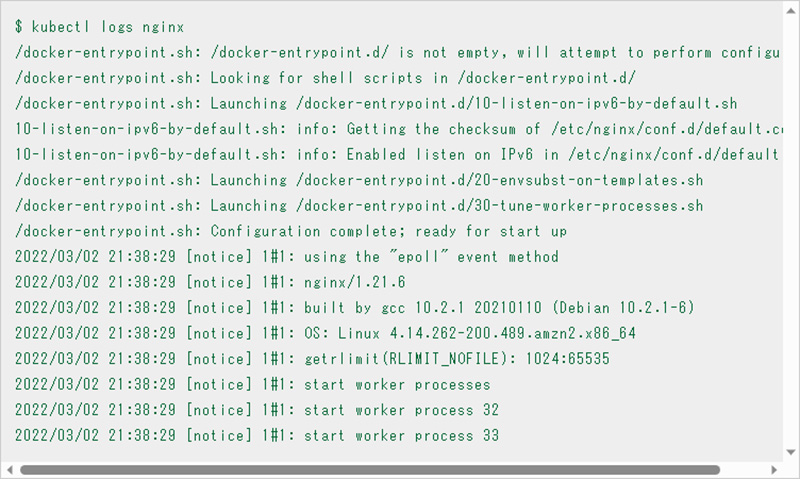
kubectl logs command
In some cases, the failure is due to an error in the middleware or application, even though it does not appear in the logs. Therefore, it is important to check the operation of the middleware or application itself once, even if no logs are found. For example, use the "kubectl port-forward" command to port forward to the endpoint port and check if the request can be communicated, or use the "kubectl exec" command to enter the shell in the container and check the operation.
Column Ephemeral Container
Depending on the container image used, there may be cases where the necessary commands are missing, making it difficult to check the operation, or "bash" and "sh" do not exist and the shell cannot be entered in the first place. In such cases, consider using an ephemeral container.
Starting with Kubernetes v1.17, the "kubectl debug" command can be used to add ephemeral containers to a running pod. This allows for smooth operation checks even for containers lacking the necessary commands. For more information, please see below.
Thoroughly Identify Layer (Root cause identification)
In this layer, root causes are analyzed and identified for the events narrowed down in the "Closely Identify Layer.
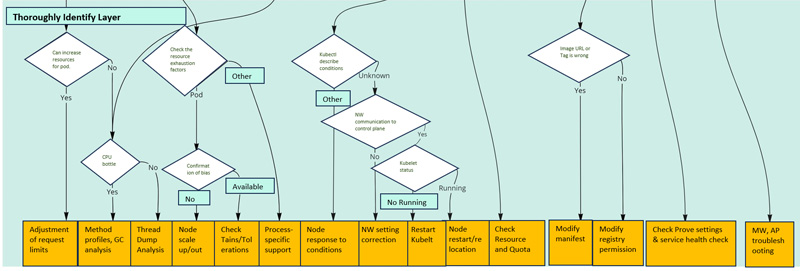
Thoroughly Identify Layer
A. Lack of pod resources
When pod resources are inadequate, resource enhancement is often the first consideration. There are two ways to increase resources: scale-up to increase limits and scale-out to increase the number of replicas. Make a decision based on the characteristics of the application and the resource status of the node.
If it is difficult to increase pod resources further due to node resources, or if pod resource usage is too large, tuning should be considered. Tuning depends on each programming language and middleware, but taking Java as an example, if the situation is CPU-bound, we will dig deeper to see if CPU usage is caused by methods or GC, and if not, we will suspect thread locking from thread dumps.
B. Lack of node resources
If a node is running out of resources, it is first necessary to isolate whether the cause of resource exhaustion is a pod running on that node or some other process. This can be checked by accumulating the resource usage of the pod.
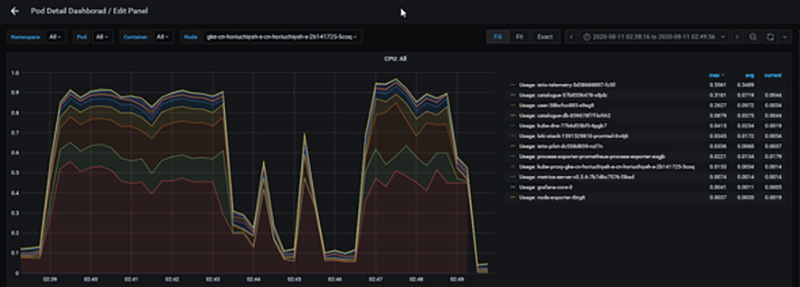
CPU usage graph for pods running on a specific node
For example, in the situation shown above, pod resources are dominant, so check to see if pods are inadvertently configured to deploy only to certain nodes, "Taints", "Tolerations", etc., and scale up/out as necessary. If a non-pod process is the cause, then if the process is something that needs to run, analyze it in more detail.
C. Delays due to middleware and application logic
In this case, proceed with the programming language and middleware tuning mentioned in "A. Lack of Pod Resources".
D. Node failure
In the case of Node failure, use the "kubectl describe nodes" command to confirm detailed information in order to dig deeper into the cause.
The "Conditions" field displays information that can be used as a troubleshooting hint for various nodes, so use this as a basis for your response (see Reference ).
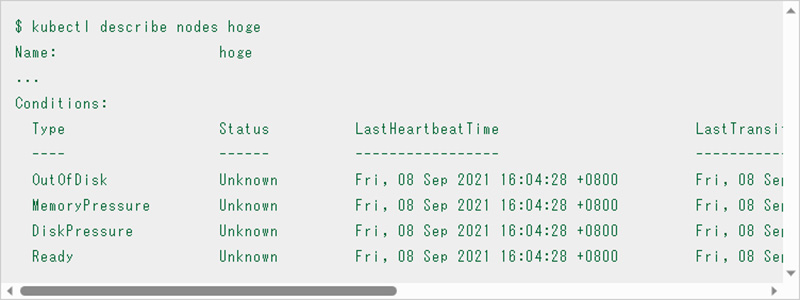
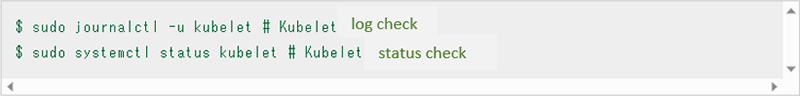
In this example, each status is "Unknown". In this case, further isolation is required. Check if there is network communication between the control plane such as "kube-api server" and the node and check the logs and status of the kubelet running on the node.
If the cause of the problem is still unclear, it is a good idea to replace the node with a new node (in conjunction with detaching the node with Drain) or restart the node. In this case, restarting the node will cause memory to jump. Please be careful since it will be impossible to analyze the cause in the future.
It is important to be aware of cost-effectiveness when troubleshooting. The more detailed the investigation of the cause, the more man-hours will be required. Therefore, if the scope of the problem is not visible, the problem does not recur by restarting nodes or recreating pods, and the problem is not critical (no impact on SLAs), it is necessary to decide to "not identify the root cause".
E. Resource Quota violation
Resource Quota allows you to define hard limits on the total amount of resources (CPU, memory), total storage resources, and number of objects for a pod on a Namespace basis. Note that when Resource Quota is enabled, pod creation will fail even if requests and limits are not set.
If you cannot deploy a pod due to a violation of the Resource Quota, first check the Resource Quota setting with the following command.

Then, check the resource requirements of the pods to see if there are any pods that seem to be requesting resources excessively, or if there are any pods for which requests or limits are not specified. The resource usage of individual pods can also be checked from the Prometheus metrics, as described above, or by using the "kube-capacity or by third-party commands such as "kube-capacity".
In the following example, "kube-capacity" is installed and used as a subcommand "resource-capacity" of kubectl using "Krew", a plugin management tool for "kubectl". In addition, to use Krew, refer Installing Page to install and add PATH. Once completed, you can use the kubectl krew command.
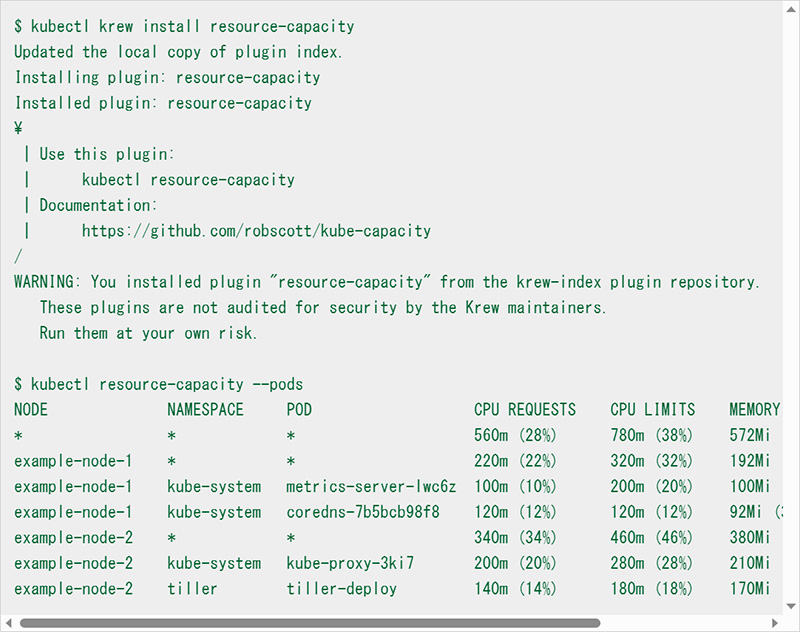
If the results of the check show that all pods have the required amount of resources, consider whether the Resource Quota can be changed. At the same time, for pods that use a large amount of resources, it is a good idea to consider tuning the resource usage.
F. Eviction
Eviction initiates pod deletion when a node's memory or disk space or number of PIDs falls below the eviction thresholds.
Eviction has "Soft Eviction" and "Hard Eviction," and thresholds for each can be set as kubelet arguments.
In Soft Eviction, the node condition (memory, disk, PID) flag, which can be checked with the "kubectl describe nodes" command, is enabled and the pod is deleted after a certain grace period. Hard Eviction deletes the pod without a grace period.
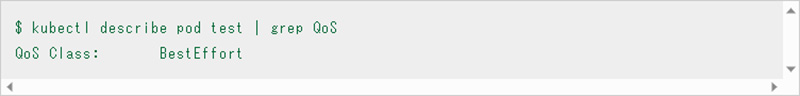
There is an order of deletion for pods deleted during eviction, which is determined from requests and limits, QoS (Quality of Service), resource usage, and priority (PriorityClass).
Pods whose QoS is "BestEffort" or "Burstable" and whose usage exceeds requests.
→ Ordered by priority and how much usage exceeds requests
Pods with "Guaranteed" QoS and "Burstable" with less usage than request.
→Pods are deleted last based on priority
QoS can be checked with the "kubectl describe pod" command.
Therefore, when eviction occurs, it is important to first make sure that the node has sufficient resources (to compensate for the total amount of resources of the pods to be run).
It is also a good idea to set the QoS to "Guaranteed" for pods that are important for running the service, and to set requests with a margin, so that the order in which eviction is deleted can be moved back in time. It is also a good idea to design resources for each Namespace using Resource Quota, since Resource Quota can be set to avoid pods starting up more than expected and hogging resources.
For detailed Eviction behavior, see "Node-pressure Eviction | Kubernetes."
G. Container image pull error
If you are getting a container image pull error, check to see if the image path or tag is incorrect in the first place.
If you are using a registry that requires authentication, check that the imagePullSecrets and the Secret used in the imagePullSecrets are set correctly, and if it is a public cloud registry (ECR, GCR, ACR), check that the permissions assigned to the node or pod that is causing the pull error (IAM, etc.) are sufficient.
H. Container restart due to Liveness Probe failure
Kubernetes has three types of Probe: Liveness Probe, Readiness Probe, and Startup Probe. For the Startup Probe, a threshold failure will cause the container to restart. Therefore, if the Liveness Probe and Startup Probe are not configured properly, or if the application is modified so that the command or HTTP request specified in Probe cannot succeed, the container will restart regardless of the application's operation. If the container is repeatedly restarted by Liveness Probe, first check the setting of probe from the pod's resource definition (YAML).
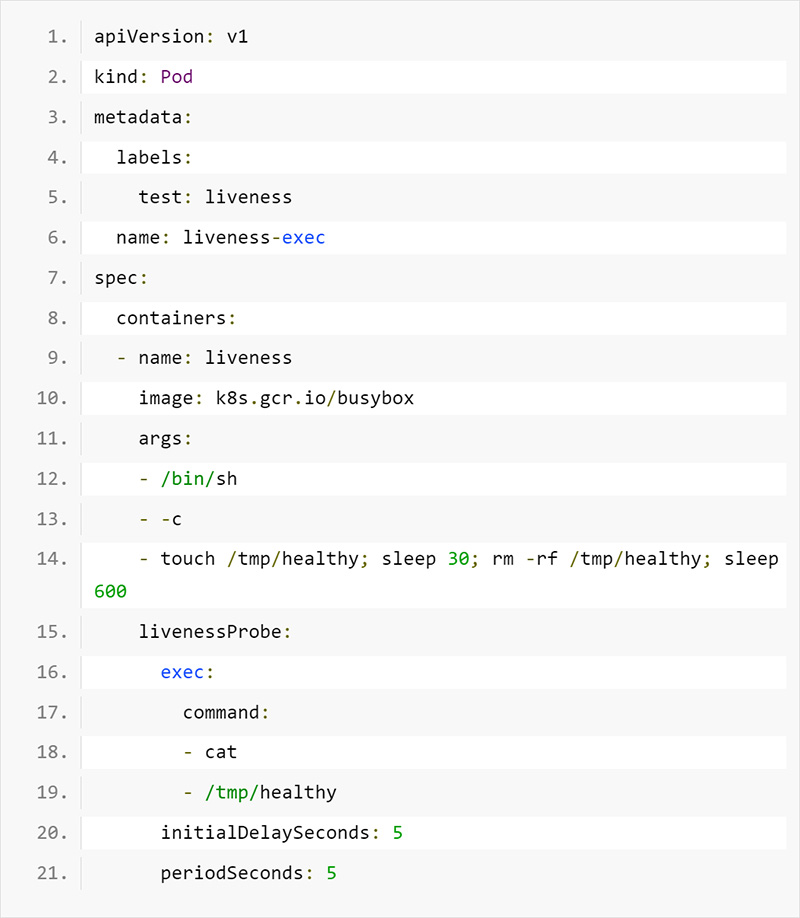
Liveness Probe definition in the pod
For example, here, the "cat" command is used to check whether a file exists in a particular path.
Next, try executing the commands and HTTP requests used by probe to the container. And if they fail, reconsider the creation, configuration, and probe of the application itself.
*The "kubectl exec" or "kubectl port-forward" command and Ephemeral Container can be utilized when checking the probe.
An important point to review is that the Liveness Probe should be set only for behaviors that require a restart if they fail (e.g., deadlock). If you simply want to make it wait to accept traffic, Readiness Probe is appropriate.
For detailed Probe behavior, see "Using the Liveness Probe, Readiness Probe and Startup Probe | Kubernetes.
I. Middleware and application errors
Based on the errors confirmed from the logs, further isolation is performed for each individual middleware and application. If necessary, such as when it is difficult to reproduce the error, the "kubectl exec" command or Ephemeral Container are used to enter the shell of the running container for detailed debugging.
Summary
This paper presented a troubleshooting flow in a cloud-native system based on Kubernetes. In a cloud-native system, problems must be identified from many components, and it is not a good idea to blindly gather the information, as there is a great deal of it. It is a good idea to identify the problem and its root cause quickly by gradually narrowing down the suspected problem and its cause in three layers ("Lightly Identify Layer," "Closely Identify Layer," and "Thoroughly Identify Layer"). We utilized the three signals of Observability introduced in the previous article: metrics, logs, and traces, to proceed with the isolation. This flow may not necessarily solve all problems, but we hope it will clarify how to proceed with the isolation and what information to check.
The next article will be about metrics and will be written from the perspective of how to implement metrics using de facto OSS such as Prometheus, Grafana, etc., and what to watch out for and what can be devised.
Original Article
This article is a translation and adaptation of an April 2023 ITmedia@IT article Kubernetes障害で泣かないための羅針盤、Observabilityを活用したトラブルシューティングフロー大公開:Cloud Nativeチートシート(14) - @IT (itmedia.co.jp)

